
// Article - How to load test in multiple concurrent regions
Written February 10, 2021
What is latency?
Latency is the delay between a user’s action and a web application’s response to that action, often referred to in networking terms as the total round trip time it takes for a data packet to travel.
Latency is generally measured in milliseconds (ms) and is unavoidable due to the way networks communicate with each other. It depends on several aspects of a network and can vary if any of them are changed.
There are four main components that affect network latency, including:
- Transmission medium: The physical path between the start point and the end point. The type of medium can impact latency. For instance, old copper cable-based networks have a higher latency than modern optic fibers.
- Propagation: The further apart two nodes are the more latency there is as latency is dependent on the distance between the two communicating nodes. Theoretically, latency of a packet going on a round trip across the world is 133ms. In actuality, such a round trip takes longer, though latency is decreased when direct connections through network backbones are achieved.
- Routers: The efficiency in which routers process incoming data has a direct impact on latency. Router to router hops can increase latency.
- Storage delays: Accessing stored data can increase latency as the storage network may take time to process and return information.
source = What is Latency?
Why Network Latency is Important
Some might argue that network latency isn’t very important, however, it can be in regards to where you choose to host your WordPress site. For media and your assets (such as images, JavaScript, CSS, Video), a CDN can fix a lot of the extra latency involved, by delivering a copy from a closer server. However, in most configurations, you still have to query your hosting server for the initial DOC load. And this is why latency matters!
Latency is especially important when it comes to businesses that serve visitors in a specific geographical location. For example, let’s say you have an e-commerce shop in Sydney, and 90% of your customers are from Australia. Your business would definitely benefit from placing your site on a server in Australia, vs hosting it in Europe or the United States. We’ll go into just how much it impacts your site below.
source = Network Latency
Factors to consider when selecting regions
It's common for people to deploy in a region where they're located, but they fail to consider if this is the best user experience. Suppose that you're located in Europe with a global user base and want to deploy in a single region. Most people would consider deploying in a region in Europe, but it is usually the best choice to have this app hosted in one of the US regions–because the US is the most connected to other regions.
source = Best practices for Compute Engine regions selection
Latency
The main factor to consider is the latency your user experiences. However, this is a complex problem because user latency is affected by multiple aspects, such as caching and load-balancing mechanisms.
In enterprise use cases, latency to on-premises systems or latency for a certain subset of users or partners is more critical.
Pricing
Regardless of being an on-premise, hybrid or cloud application, your platform will still require compute services, which of course, depending on the region you purchase them from, they have different prices. The pricing usually differs due to specific tax regulations imposed in the different regions.
Feature availability
This specific characteristic only applies to hybird or cloud applications. When using the cloud fully, or just parts of it for your application, you usually use the underlying services in the cloud as building blocks for your platform. These specific building blocks differ from one cloud to another, from many points of view, such as availability, pricing, terms of use, etc.
Furthermore, not only do different cloud providers offer different services, but the same cloud provider might not be able to present you with all of its services in all regions. For instance, while the region us-east-1 in AWS might contain all services that AWS has to offer, it also makes it the most utilized (to be read "bloated") datacenter that AWS has because everyone deploys there in order to make use of the entire AWS offering.
Analyzing response times and traffic volumes
Response Time
Response time refers to the time it takes for an inquiry from a user to receive a response from a server. Response time can be broken down into five parts:
- DNS lookup: This is the time it takes to resolve the hostname to its IP address. If the DNS lookup time is high, this may indicate an issue with the DNS servers.
- Connection time: Referring to the time it takes to connect to the server, these results are generally used to identify network latency. High connection times are often caused by network or routing issues.
- Redirect time: This refers to the time it takes for any necessary HTTP redirects and any extra DNS lookups or connection time during this process.
- First byte: This refers to the time it takes for the first byte of data to transfer. Slow times here can signal issues with server load.
- Last byte: This refers to time it takes to download the final server response. A problem here indicates a bandwidth issue, so you may need to upgrade your bandwidth to increase download speed.
source = Page Load Time vs. Response Time – What Is the Difference?
How to Check and Measure Response Time
To measure server response time, you can use a few potential metrics. Most often, admins measure server response time with a term called Time to First Byte (TTFB), which represents the time it takes in milliseconds for a browser to receive the first byte of the response from a server. With knowledge of this measurement, admins can better check server response time and understand when and why a server might be running slowly.
In addition, application response times can be measured by tracking the time it takes for a server to respond to a request from a client application. TTFB measurements apply in this case but measuring application response time might also require monitoring network elements like TCP application ports or other database resources.
When considering response time—especially in the context of user experience and overall performance—it can be useful to refer to a few different measurements, including:
- Average response time: It is essentially the average round-trip request time (as for loading HTML, JavaScript files, or images). Slow system components lower this average.
- Peak response time: It can help you understand which components, queries, or requests may be dragging down response times.
- Error rate: This shows you how many requests are problematic when compared with all occurring requests (within a certain time frame).
How To Improve Server Response Time
Once you begin checking and monitoring your server and application response times, you’ll be able to more effectively improve server response time. Here are a few best practices to implement.
- Improve database performance: There are many ways to optimize your database performance, and all of them can have a big impact on critical applications and servers. Rewriting queries, changing your schema to group objects to be more effective, and taking the time to ensure you’re using your database correctly are good first steps.
- Optimize web servers: As with databases, optimizing your web servers can be a big undertaking, and it might require buying some automated tools to help. But if you want to improve response time, the costs are worth it.
- Know what to monitor: If you want to improve server and application response time, you should regularly check attributes like CPU load usage, storage resources, and memory. Even virtual machines need to be checked for resource allocation and hardware malfunctions, since these elements can have negative impacts on response time.
- Update hardware: Unfortunately, slow response time isn’t always about optimizing your system—sometimes the problem is maxed-out, over-virtualized, or out-of-date hardware. If metrics like CPU or memory are always problematic, it could be time to rethink your hardware resources.
Use Rungutan to understand response times
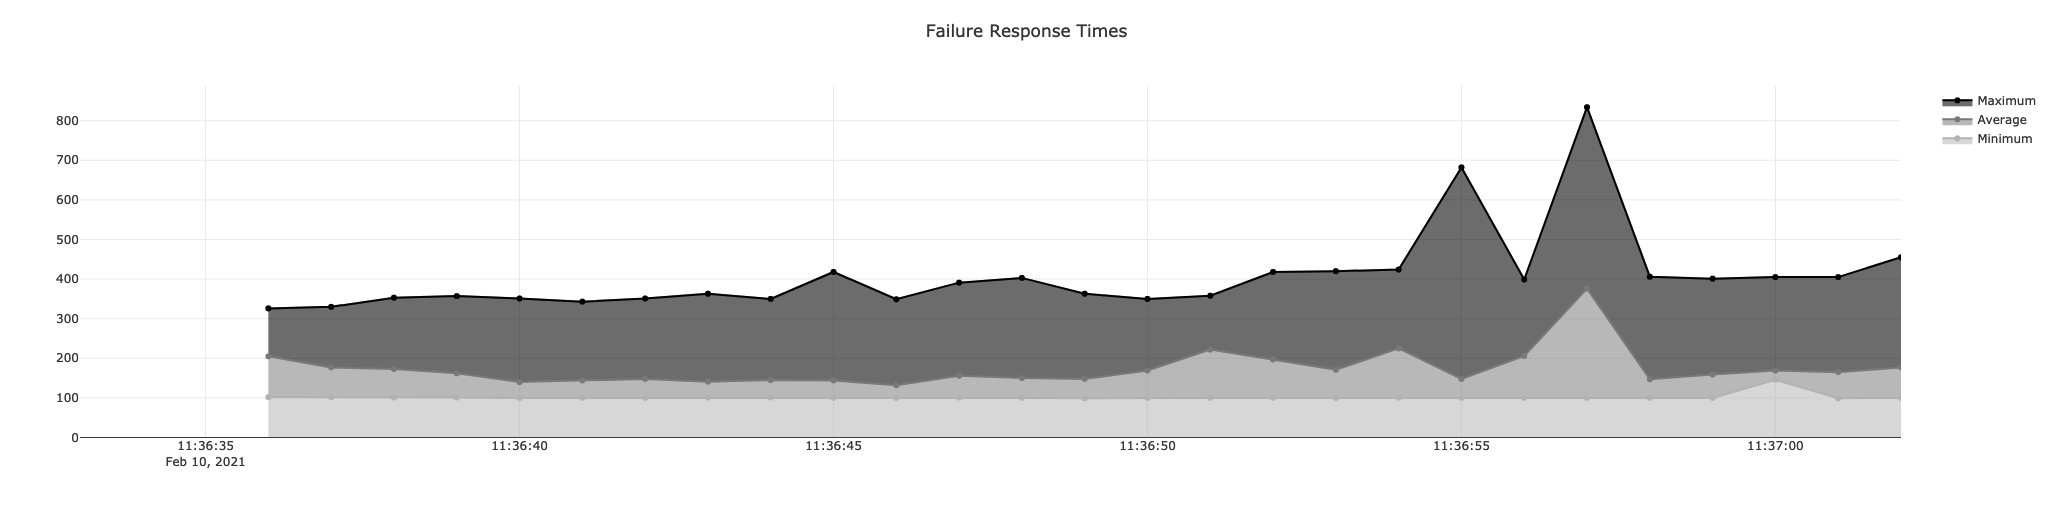
Graphs
Rungutan gives you a granular 1-second level audit of response times across all requests that were sent towards your platform.
Since tests can be done using a concurrent region logic, you can therefore drill down and understand how traffic patterns affect your application while being accessed from different parts of the globe.
An overall image of all requests is also available, as well as a per-region specific interface can be selected using the "Change Region" button in the top menu.
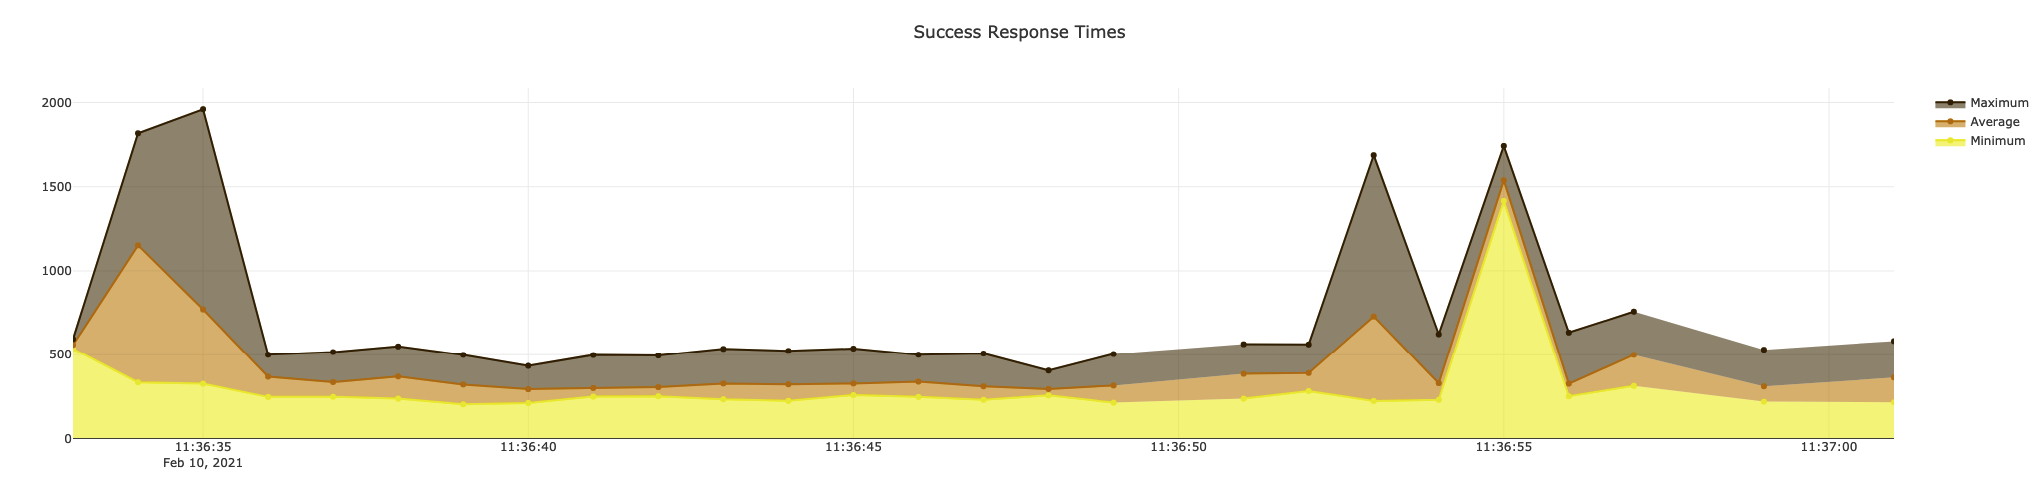
Rungutan offers not only 1-second granular graphs, but also the possibility to filter and limit the response times you want to visualize through the advanced control mechanism available for each graph!
And of course, Response Times are also available for failed requests as well, since as an application owner, you're interested how long it takes to consider a request as failed too.
CSV Failures
Rungutan employs the possibility of actually checking the response that was offered by your API in order to further understand and debug your platform's traffic support.
Using this technique, you're able to see regional stats for each step in your workflow as well as occurences of those responses for each region.
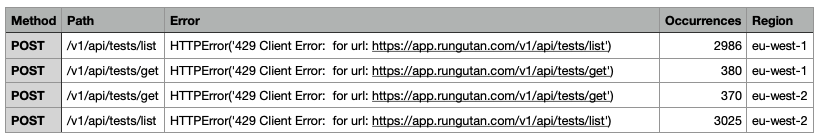
This is a sample generated CSV in which we notice that around 3.3k requests have been dropped by our Web Application Firewall systems and received the status code of 429.
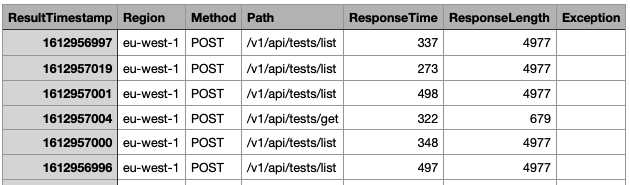
CSV Detailed Stats
Furthermore, Rungutan also offers a deep dive into the requests that are being sent in order to assist you in further analyzing your request and response patterns.
This trace records all the possible details of exactly 1 request each second in each region for each step in the workflow.
This is a sample generated detailed stats CSV in which we can observe not only the Response Time, but its length as well as any exception that might have occured.
Final thoughts
Response times are a matter of user experience: How much time does it take before the computer is ready to serve the user? The reasons behind delays don't matter to users. All they know is that they're getting poor service, which is annoying.
Regardless of how you architect your platform, as long as your clients will be accessing your app from the entire globe, then you should strive to offer the same GREAT level of experience to all of them.
In short, it's not the user's fault that he's too far away from your servers! That's why the possibility of load testing from multiple concurrent Regions using Rungutan is such a blessing. Because you can literally see how your platform's performance is affected when being accessed from different points around the globe!