
// Article - How to set up load testing alerts
Written January 27, 2021
Why should I set up an alerting system?
Alerting gives timely awareness to problems in your cloud applications so you can resolve the problems quickly.
To create an alerting policy, you must describe the circumstances under which you want to be alerted and how you want to be notified. This page provides an overview of alerting policies and the concepts behind them.
Each alerting policy specifies the following:
- Conditions that identify when a resource or a group of resources is in a state that requires you to take action. The conditions for an alerting policy are continuously monitored. You cannot configure the conditions to be monitored only for certain time periods.
- Notifications that are sent to let your support team know when the conditions have been met.
- Documentation (optional) that can be included in some types of notifications to help your support team resolve the issue.
source = Introduction to Alerting in Google Cloud Platform
The alert system in the Rungutan platform has been created to assist you and your SRE team to fully understand the service level that your platform offers at any time.
We do this by measuring the response times and failure rates of any and all your tests and deciding based on the thresholds that you have set up whether to send you an alert or not.
This means that we have unlocked the following use cases for you and your team:
- Release Monitoring - Combined with the fact that you can use your preferred CI/CD system (read our article on CI/CD), you can now be alerted after each and every release if any performance optimizations problems have been introduced in either your code or your infrastructure changes
- Cron Monitoring - Besides release testing, you can scheduled automated Cron Jobs which act as scheduled tasks that run normal tests at specific intervals (eg Daily, Weekly, Monthly)
Types of alerts
Failure Occurences Percentage
One of the alerts that you can set up on the Rungutan platform is related to the number of failures in your tests.
As you may have seen on our platform should you have made a test and checked its results, there are a few graphs that show up for each and every step in your workflow. These are:
- Success Requests Per Second
- Failure Requests Per Second
- Success Response Times
- Failure Response Times
- Percentile - Success Response Times
- Percentile - Failure Response Times
This specific alert relates to the number of requests that have failed out of the total number of requests simulated by your tests.
Fun math time:
Example -> 2.000 total requests comprised of 1.5000 successfull and 500 failed

percentage_failed -> 500 (failed requests) / 2000 (total requests) * 100 (as percentage) = 25 % requests failed out of total
Since the value that you define when creating such alert is the actual "approved" percentage value of failure requests, anything above that will trigger an alert!
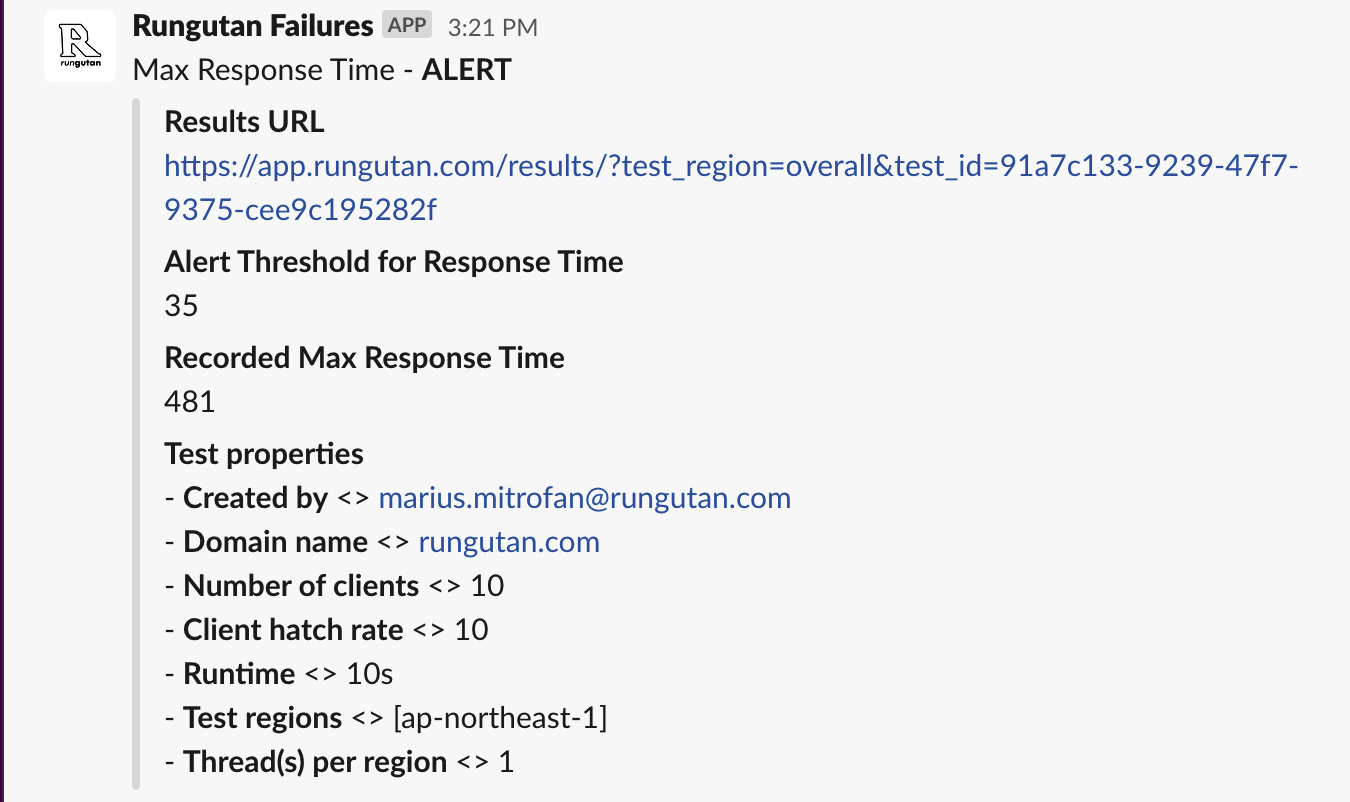
Max Success Response Time Milliseconds
The other type of alert that you can set up on the Rungutan platform checks if the response time of your simulated tests are lower than the approved threshold that you have set up.
It's not enough for your platform to withstand a huge amount of users! It should also provide a decent response time for them, in order to ensure not only that you meet the contractual SLAs defined for your customers but also because companies literally lose money due to slow websites as users tend to simply close your web page if it loads too slowly.
This specific check measures if all the response times within your load test are smaller than the approved threshold that you have set up, and if they aren't, it promptly lets you know by sending an alert.
Since the value that you define when creating such alert is the actual "approved" response time in milliseconds for any and all of your successful response times, anything above that will trigger an alert!
Alerting channels
One of the easiest ways to set up an incoming alert is by using the EMAIL channel, which does exactly what it says -> it sends you an email with the alert name and the test that triggered it.
You can set up as many alerts with the same channel (but different types/values) as you need, based for instance on the impact of the value -> warning versus critical.
Here's how an email alert looks like:
Hello,

One of your tests recorded a 50 percentage failure rate and triggered this alert with a threshold of 1.

Use this link to view the results -> https://app.rungutan.com/results/?test_region=overall&test_id=${obfuscated_url}

This test was launched by [email protected] against domain domain.com with the following properties:

    * Number of clients = 10
    * Client hatch rate = 10
    * Runtime = 10s
    * Test regions = [ap-northeast-1]
    * Thread(s) per region = 1

Warm regards,
The Rungutan Team
Slack
Slack is a proprietary business communication platform developed by American software company Slack Technologies. Slack offers many IRC-style features, including persistent chat rooms organized by topic, private groups, and direct messaging that was launched in August 2013.
Our integration with slack is based on Incoming Webhooks, which are a simple way to post messages from apps into Slack. Creating an Incoming Webhook gives you a unique URL to which you send a JSON payload with the message text and some options.
Creating a Slack Incoming Webhook is simple and requires following these simple steps:
- Create a new Slack app using this URL -> https://api.slack.com/apps/new by generating an app name and selecting the proper workspace
- Click on Incoming Webhooks under the Features section and activate it by clicking on the toggle
- Click on Add New Webhook to Workspace while in the Incoming Webhooks screen and then pick a channel and hit Allow
- Copy the new URL by clicking the Copy button and use it in our platform
When all is done and ready, here's how an alert would look like:
Final thoughts
Automated alerts are essential to monitoring.
They allow you to spot problems anywhere in your infrastructure, so that you can rapidly identify their causes and minimize service degradation and disruption. If metrics and other measurements facilitate observability, then alerts draw human attention to the particular systems that require observation, inspection, and intervention.